Analysing and Predicting Stock Market Trends
Aim
This notebook aims to provide a brief outline the results from a stock-market analysis, demonstrating how LSTM RNN models can be implemented with Keras and Tensorflow. It's important to note that all results discussed in this post are intended to be high-level, though the reader is encouraged to review this colab notebook for a more detailed analysis and a discussion of the underlying code.
Notes on the data
Data was downloaded from Yahoo finance, which includes the following features:
- Opening share price at the start of each trading day.
- The closing share price at the end of each trading day
- The volume of shares traded on each given day
- The highest share price on each given day
- The lowest share price on each given day
- The adjusted closing price for each share on each given day. Note that this value is an amendment to a stock's closing price to accurately reflect that stock's value after accounting for any corporate actions. It is considered to be the true price of that stock and is often used when examining historical returns or performing a detailed analysis of historical returns.
I specifically reviewed the following tech stock, to compare the performance of that industry to the S&P500: Apple, Google, Facebook, Square, Twitter, Amazon, Tesla. Note that the S&P 500 index tracks the performance of the 500 large companies listed on stock exchanges in the United States. It is one of the most commonly followed equity indices, and many consider it to be one of the best representations of the U.S
Summary of Results
Square was King!
Our first step is to plot the raw stock prices. This showed that the S&P 500 outperformed all of the other stocks in terms of absolute values, but this is something that was also to be expected, since the average spare price an S&P500 position is higher than that of the other tech stocks analysed.
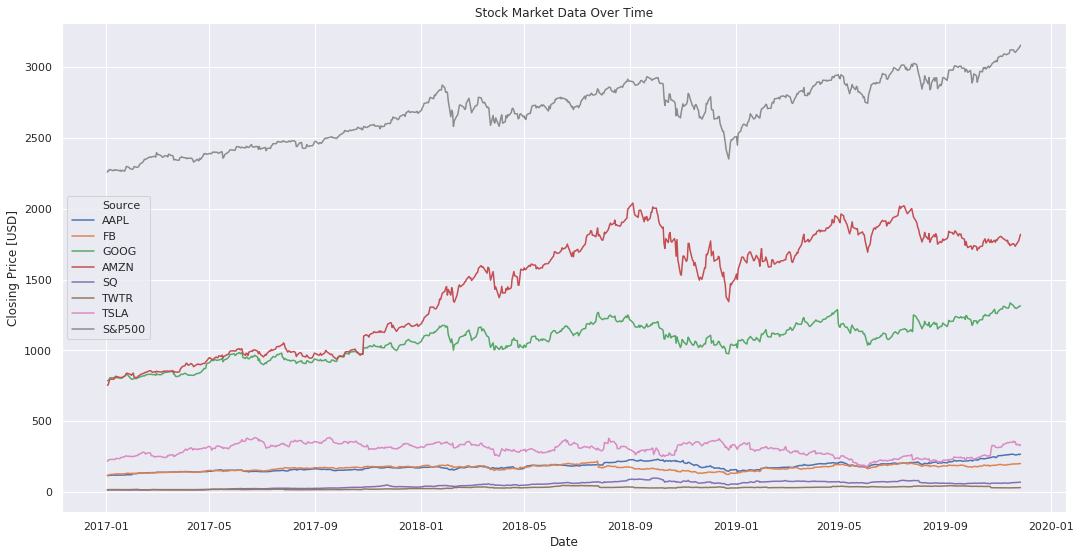
Figure 1: Stock Prices Over Time
A more meaningful measure of change comes from the analysis of the standardised stock data in Figure 2 (i.e. divide all subsequent entries by the first entry in the time series). From the graph, we're able to track relative change in the stocks over time, or stated more simply, we see how each stock increased in value since January 2017. The results clearly show that Square vastly outperformed all of the other stocks, have increased by a factor of 5 since 2017 (which compares to a increase of ~2.5 for Amazon's share price).
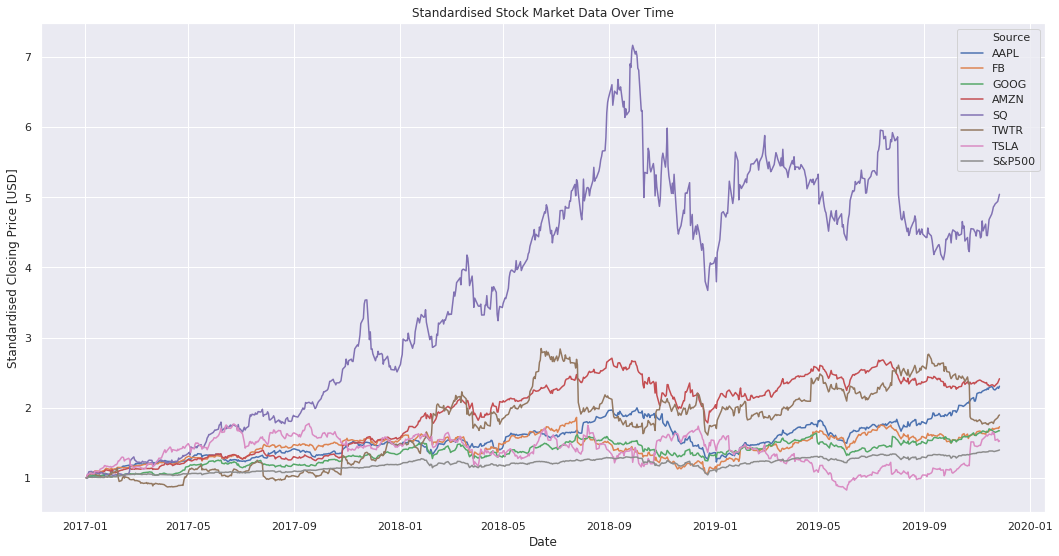
Figure 2: Standardised Stock Prices Over Time
Tesla was Turbulent
The analysis of the raw stock prices in Figure 1 showed that there is a strong correlation between the performance of all stocks (i.e. if one goes up, the other does too). This begs the question, what stock was least correlated with the US market as a whole. For this, I use the S&P 500 index as a standard for overall market performance. I subsequently plot the share prices for each stock against the S&P on each trading day, fitting a correlation like to determine which stocks were more correlated.
Put simply, the graph of stocks that closely track market performance will follow a 45$^{\circ}$ line and have an $R^2$ value of 1 or -1. Anything that has an $R^2$ value close to 0 traded very differently to how the overall market performed.
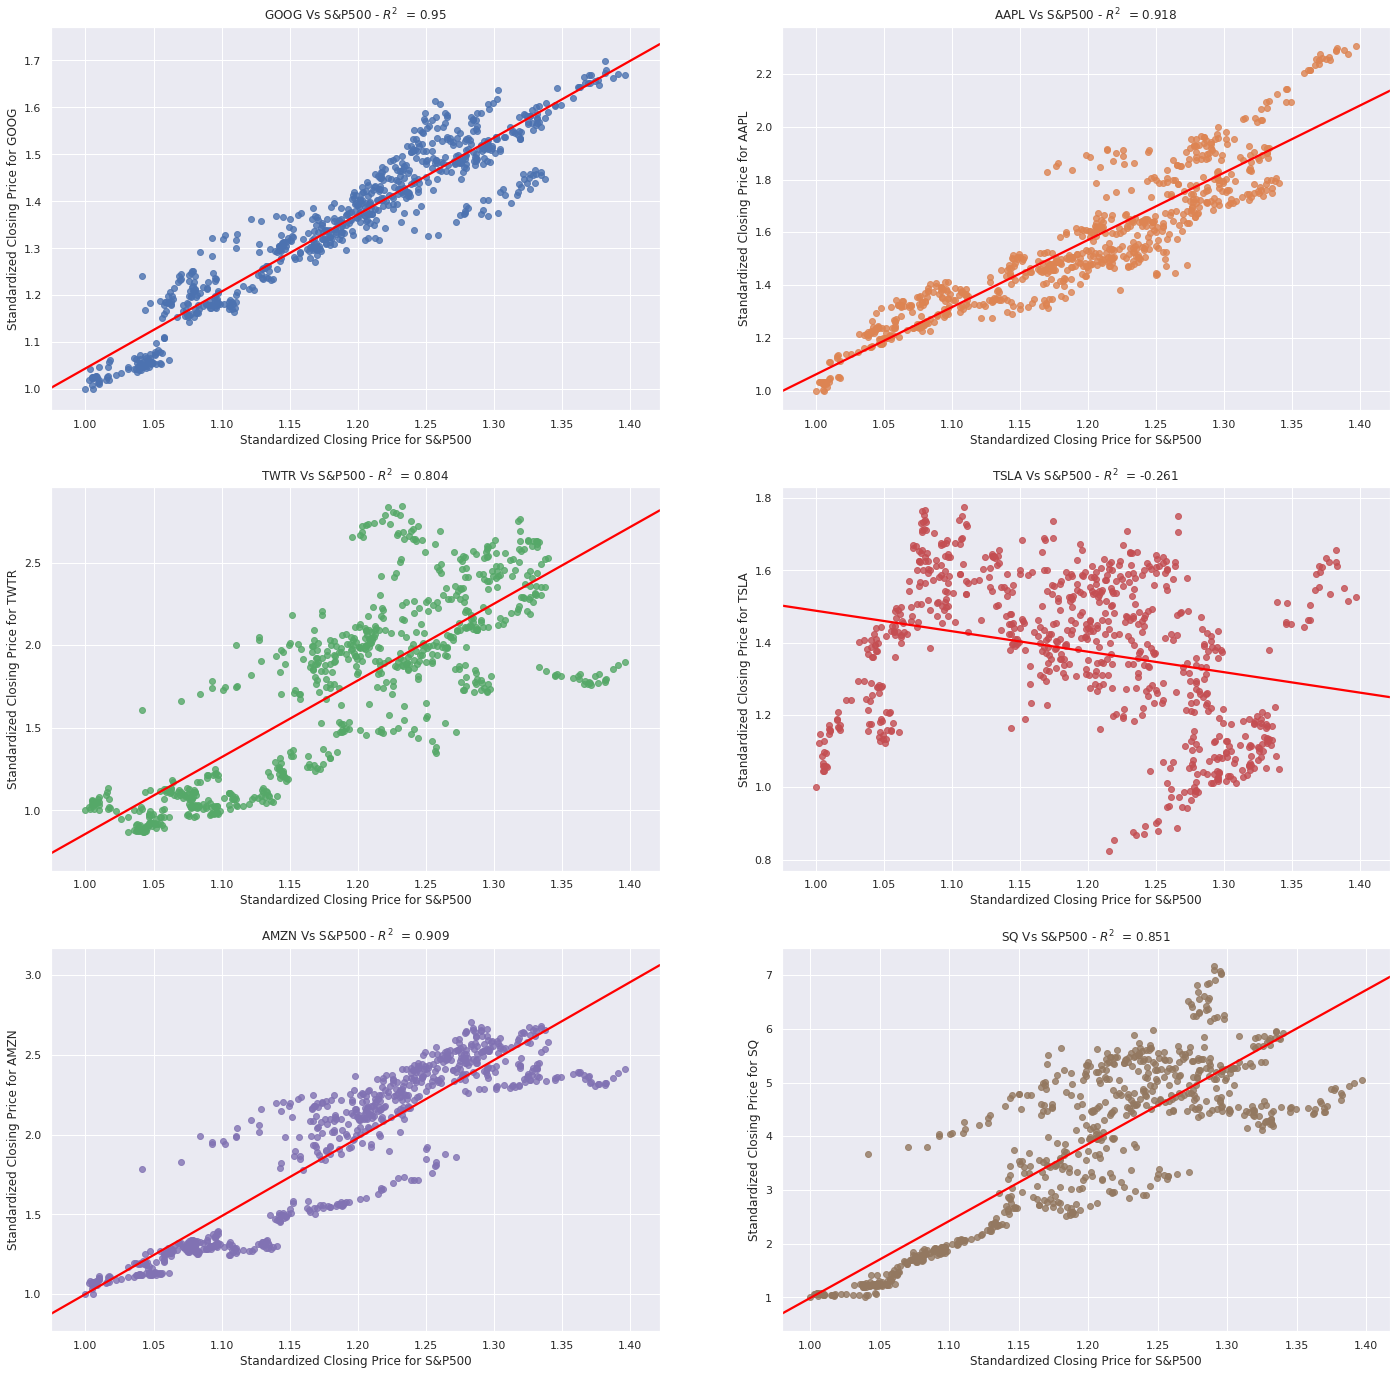
Figure 3: Summary of Correlations Between Daily Stock Prices and S&P500
Predict Stock Prices with Keras & Tensorflow
Firstly off, it's important to note that the prediction of stock market data is difficult. Though some readers are bound to want to take the techniques introduced here for security predictions, past performance is not always a good predictor of future returns in the stock market. Machine learning is more applicable to datasets where the past is a good predictor of what is yet to come, but that's not the point of this section. This section simply aims to demonstrate how the reader might go about make predictions with LSTM models in Keras.
The Keras API is a deep-learning framework for Python that's used to predict stock market prices. Using the sequential API, I was able to create a multi-layer deep-learning framework to predict the daily closing price using (1) today's opening price and (2) data from the previous daily trading window. Though the sequential Keras framework does not allow you to create models that share layers or have multiple inputs or outputs, the framework does allow for the quick and flexible way to make predictions in little time.
The results for the 4-layered model are presented in Figure 4, demonstrating a clear correlation between predictions and actual trends (i.e. 0.01053 RMSE). Further improvements could be made with the inclusion of additional signals, though the analysis does illustrate the power of Keras and DNN models.
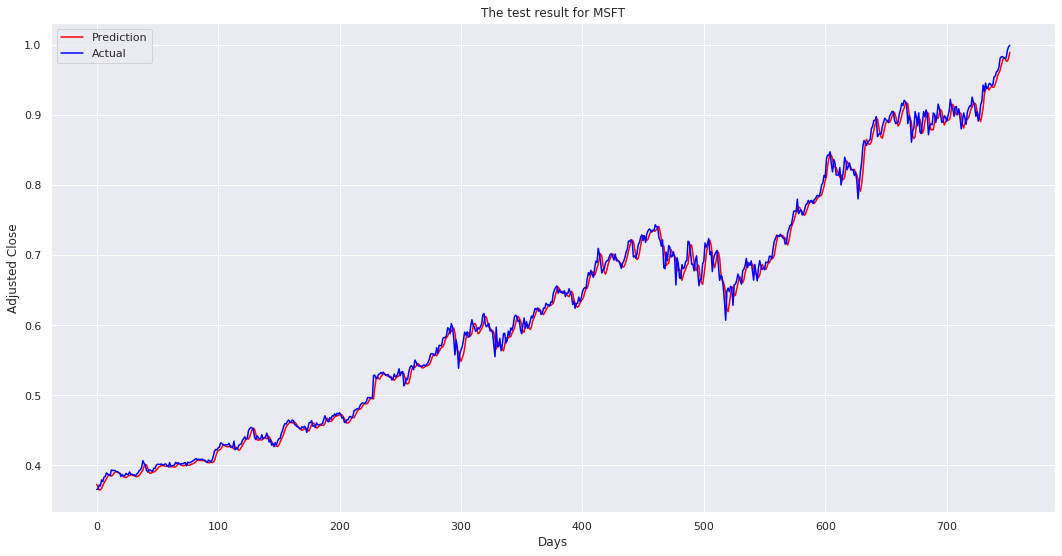
Figure 4: Summary of results from from Keras LSTM Model
Please refer to this colab notebook for all model code, and the Tensorflow hub for a library of reusable modules.