[Data Analysis] Dublin Property Trends
Analyse and Map Property Price Trends
Looking for a house can be stressful. Where to go, what to spend, where the competition is. There's a lot of choice, but little analysis of the market as a whole.
As such, I spent the day reviewing data from the Property Price Register - a live dataset of all residential properties purchased in Ireland since the 1st January 2010. With information relating to the date of sale, sale price, and the address, this dataset provided me with enough base information to obtain the geospatial coordinates for all house sales using the Google Maps API. For there, I was set to answer a few questions that I had about the property market in Dublin, including:
- What are mean and median sale prices for all Dublin houses and apartments?
- How have the prices changed since 2010?
- What is the distribution of property prices? For example, are most properties over €500,000?
- Where are the properties being sold?
- And finally, what is the most expensive location in Dublin?
This post aims to answer those questions, and demonstrates how data can be used to help property buyers make better informed decisions. The main results are outline in this article, though the reader is encouraged to review this colab notbook for a detailed description of all charts and code. A very brief description of the methodology is also outlined in the following section, with a more detailed list of assumptions available in the code.
Overview of Methodology
Having downloaded the data from the property price register (PPR), the next steps are (1): to adjust all prices for inflation and (2) to convert addresses into geographic coordinates. This latter process is referred to as Geocoding, and can be completed using the Google Maps API. Taking the messy PPR addresses, we're thus able to standardise all addresses, returning the latitude and longitude coordinates for plotting. The overall process required the use of the following tools to complete the task:
- Colab and Python as the coding environment and language
- Pandas, Numpy, Matplotlib and Seaborn to analyse and plot trends
- Google Maps API to query each address; and
- Open Street Maps and Folium to plot results.
The reader is referred to this colab notebook to review all code.
Results
Analysis of Raw Volumes and Prices
An analysis of annual sales data in Figure 1 shows how stark volumes of Irish property sales have changed since 2010. More specifically, the distinct impact of the Post-2008 recession is clearly observed in the initial years, where volumes of Dublin properties sales are shown to have dipped below 400 per month in 2011. Since that time, however, a clear resurgence in property sales has occurred, with an average of 1,500 properties being sold in the Irish capital each month since the start of 2018.
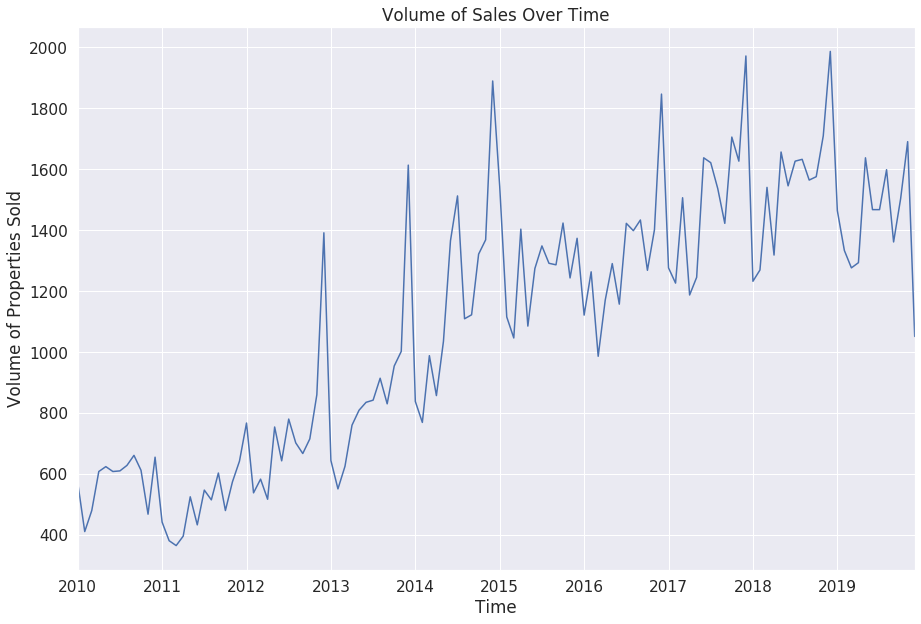
Figure 1: Volume of Dublin Property Sales over Time
These trends are also reflected in the analysis of inflation-adjusted prices in Figure 2, where the mean monthly price is shown to have increased from a minimum of €260,000 in 2012 to €660,000 in 2018. This stark difference puts into perspective how dramatically the Irish property market has changed over the past decade, though it's important that any analysis of mean prices be taken with a grain of salt. Indeed, outliers tend to skew how much the average house in Dublin would have sold for (i.e. a few high value house sales would have pushed out the annual average mean), which is why the median value was plotted in Figure 2, providing a more representative metric of how much the average consumer should expect to spend. This shows that the average property sold for €176,000 in December 2011, and increased by 100% to €352,000 August 2018.
And, no matter what metric we use to analyse the market, the overall trend remains the same - the boom is back and property prices have increased dramatically!
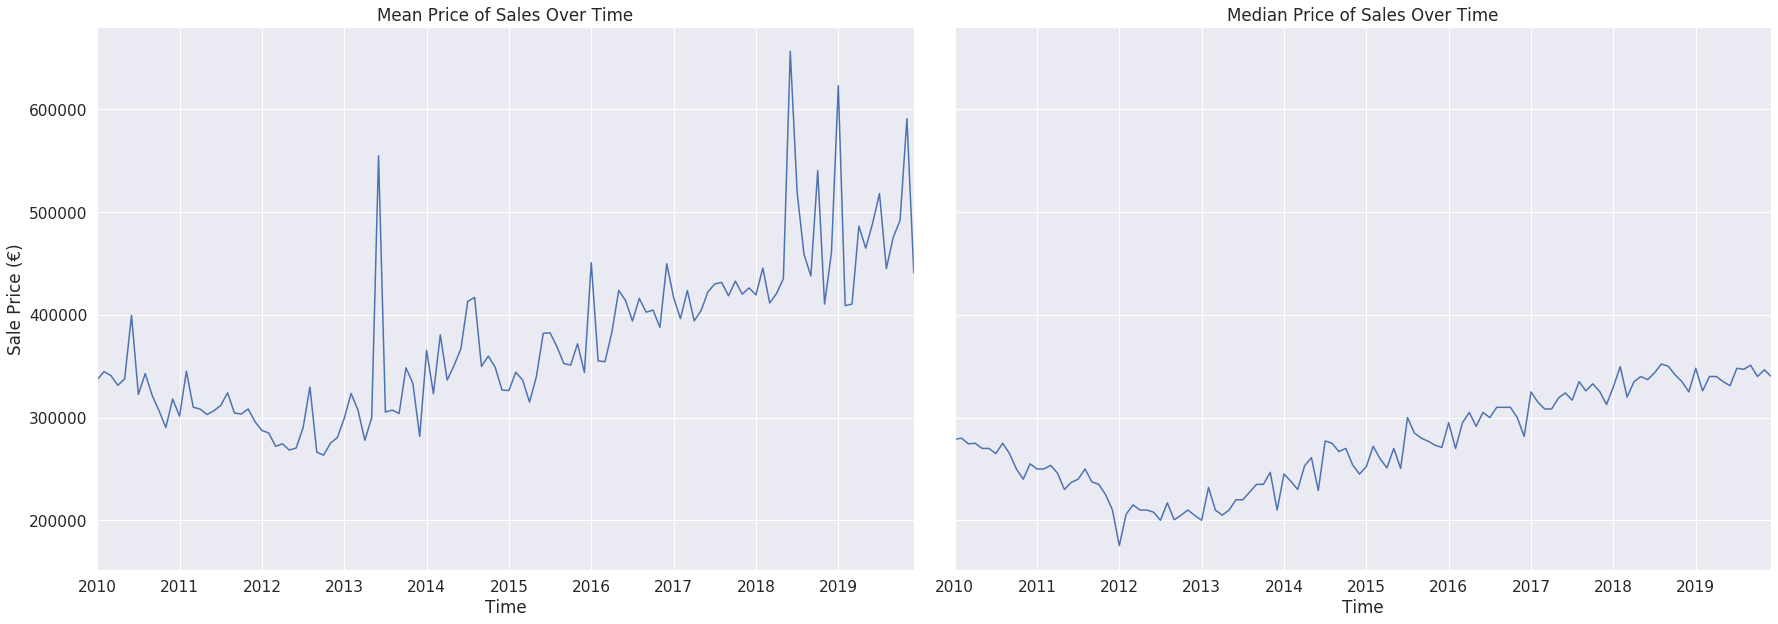
Figure 2: Mean (Left) and Median (Right) Prices over Time
Year-over-Year Changes
An interesting observation from all plots of annual sales volumes/prices shows that any increase in price is tapering off. This trend is more accurately demonstrated with an analysis of year-over-year changes in median house prices in Figure 3, where annual increases are shown to have dropped from 15% in 2014 to a more modest changes of 1.4% last year.
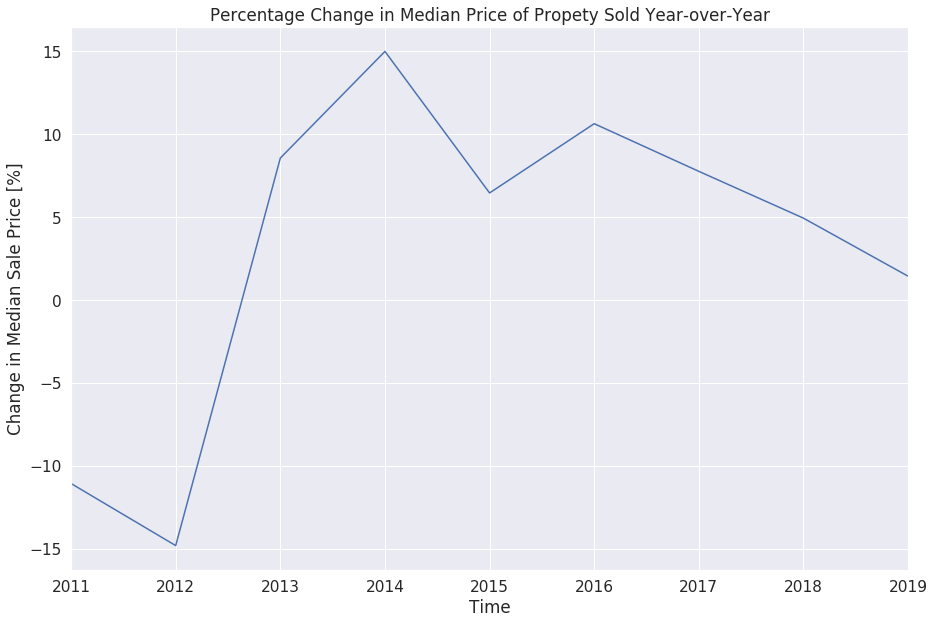
Figure 3: Year-over-Year Change in Median Dublin Property Prices.
One other interesting trend to observe from the analysis of sale volumes in Figure 1 is the peak in property sales in November of each year. This is attributed to people not wanting to search for houses for another year, with Geralyn Byrne of Sherry Fitzgerald noting that “Traditionally November has always been a really terrific month for sales because you’ve got people who have been out there looking saying, look, another year is about to pass. Let’s focus.” People also tend to be away over the summer, which is shown in the troughs in sale volumes during that time each year. So, if you want to get a good deal, look early in the year, when competition is lowest. The early work catches the deal, and property is no exception!
Violin Plot to Observe Trends
Though not commonly used, violin plots make for a great way to share data. They're easy to explain, they're intuitive and attractive, and they accurately depict how data is distributed across groups.
In this case, it's a great way to observe how inflation-adjusted property prices have changed across Dublin between 2010 and 2019. As shown in Figure 4, the median annual-values are represented using the white dots, with a long tail of prices over €500,000 clearly observed. Indeed, this plot directly leads onto the next question that we wish to address: How have the volume of sales changed by price-cohort year-over-year.
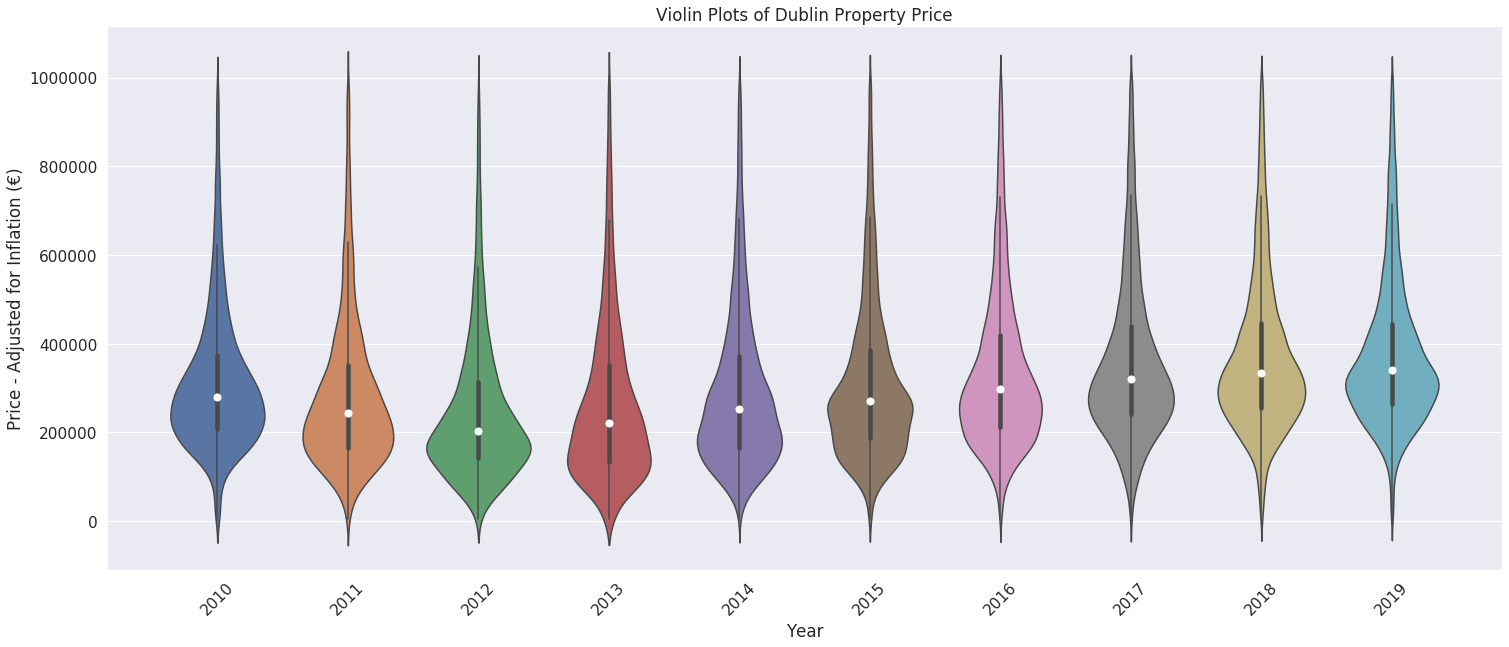
Figure 4: Violin Plots for Dublin Property Prices.
Cohort Analysis of Sale Volumes by Price-Bucket
To determine what proportion of houses are being sold by price-cohort, we need to complete a few initial steps to prepare the data. More specifically, all property prices were first adjusted for inflation to insure the relative spending power of the Irish euro is taken into account over time. Next, the number of houses being sold by inflation-adjusted decile was counted (i.e. any houses between €100,000 - 199,000 are counted in the €100k bucket), all of which allowing us to trace the changes in sale volumes by price over time.
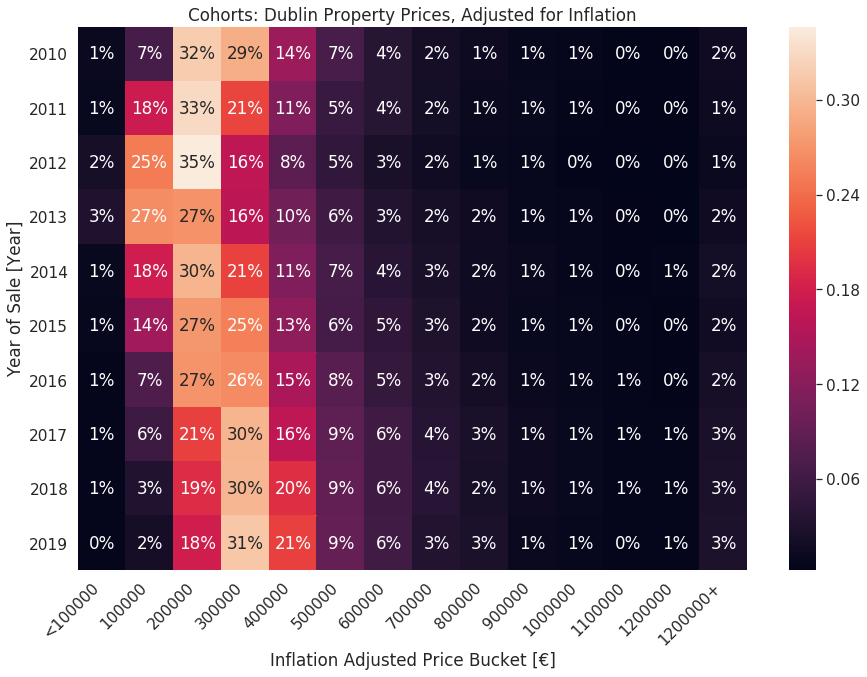
Figure 5: Cohort Analysis of Dublin Property Prices, by Decile.
The final results are outlined with the cohort-analysis in Figure 5, where a few noticeable trends can be observed.
- Firstly, there is a clear increase in the value of houses sold, where 52% of properties had a sale price between €300-499,000 in 2019 (up from 24% in 2012).
- This increase in the sale of houses between the €300-499,000 bucket directly correlates with the drop in volume of properties below the inflation-adjusted sales prices of €300,000. For example, 62% of properties sold in 2012 were below €300,000, which compares to 50% in 2019. Likewise, the number of properties being sold for less than €100,000 dropped from a peak of 3% in 2012 to less than 1% last year.
- Finally, 72% of all properties being sold in Dublin in 2019 were less than an inflation-adjusted price of €500,000. The market for properties above €1.2 million has also been steadily increasing from 1% in 2011 to 3% last year.
All in all, the graph clearly indicates that the boom is back, and people are beginning to spend money on Irish property once again.
Plotting Data by Location
Finally, it's time to look at the most popular locations!
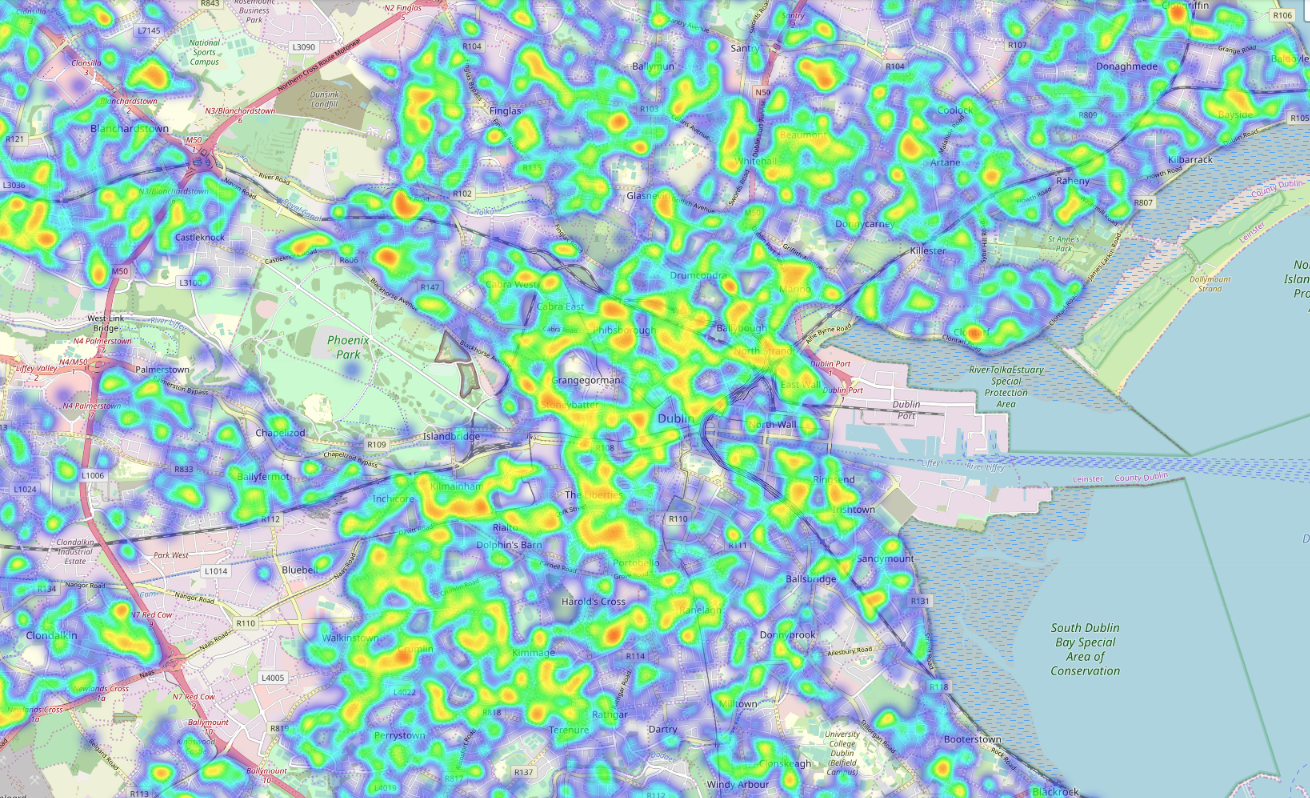
Figure 6: Heatmap showing Volume of Dublin Property Sales in 2019.
Having used the Google Maps API to collect geocoded data, volumes of 2019 property sales were plotted in Figure 6 to show areas with highest sales (i.e. red represents a high volume of sales and a blue represents a low volume). More interestingly, however, is the clear socio-economic divide that can be observed from the plot of median sale prices in Figure 7. A market of even wealth distribution would be represented using a monotonic green plot - a trend that is not observed here. Instead, property prices are shown (in red) to be disproportionally higher in the South around the Portobello/Ranelagh areas. Though a few pockets of red are also observed in the North around Drumcondra and Clontarf, the overall data is clear - the value of properties is unequal across the Irish capital. More detailed interactive plots can be obtained by running the following following code, with additional details available from the author at niall@vectordatascience.com.
Figure 7: Heatmap showing Dublin Property Sales by Price in 2019.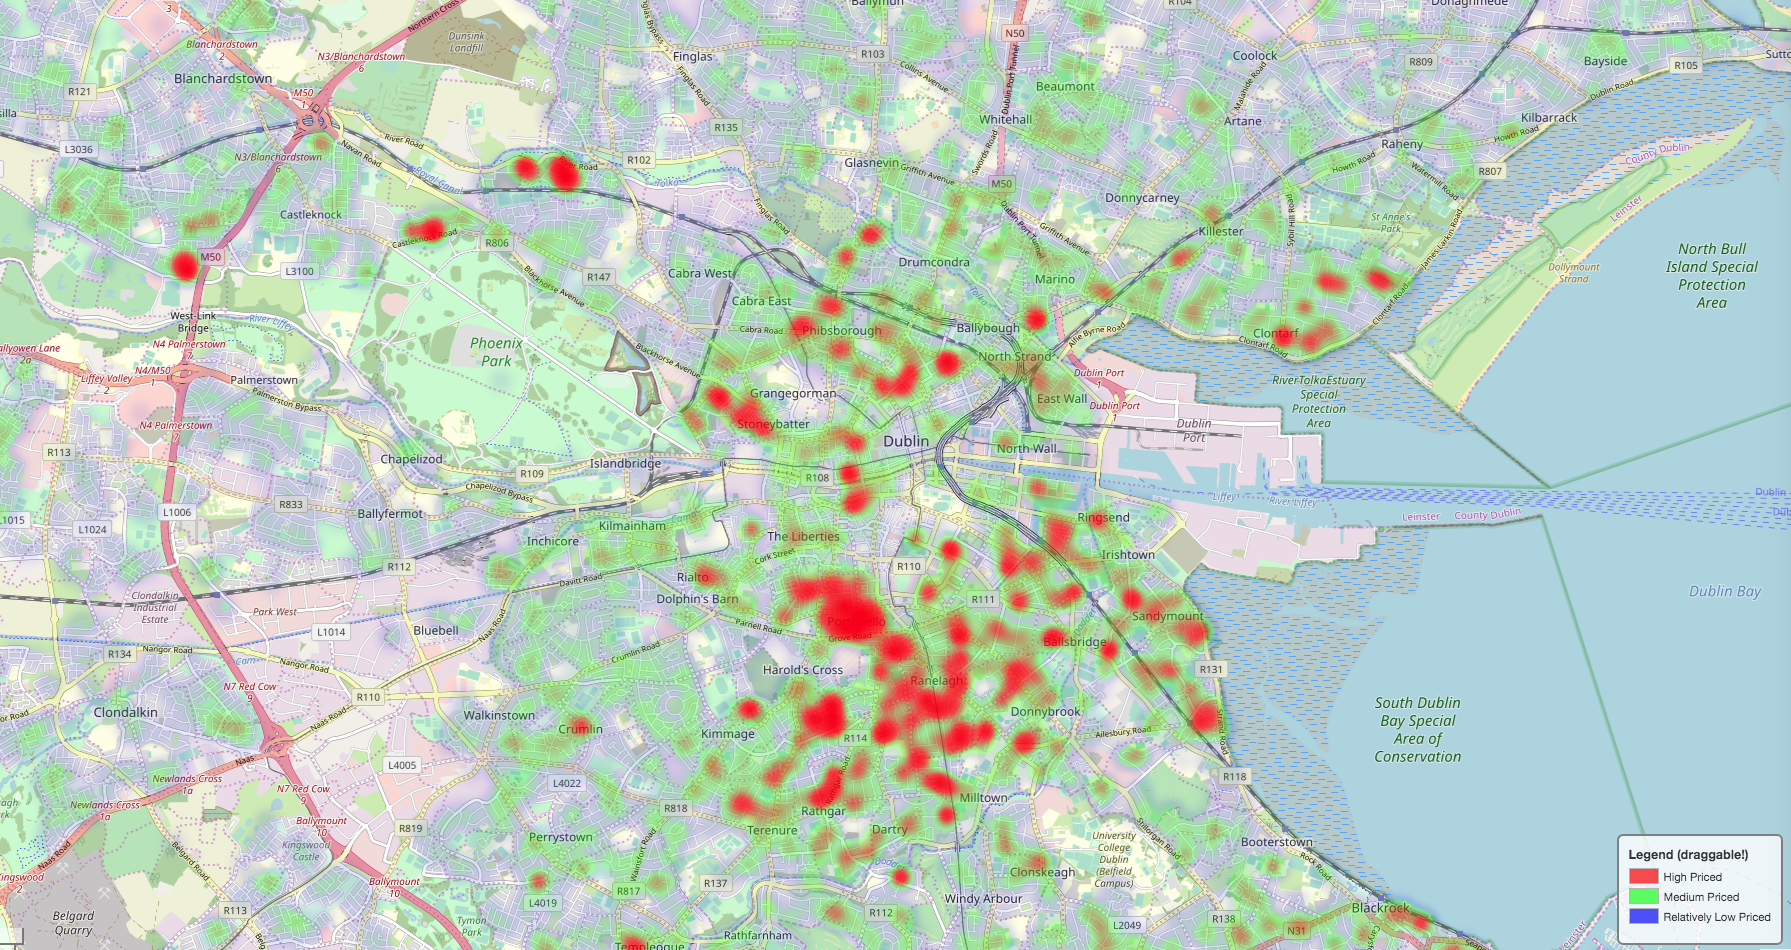
Summary
And that's it! All code is available here, and hopefully it can be useful to others. It certain domonstrates how things have changed in Ireland over the past decade, and the how property prices vary across the Irish capital.